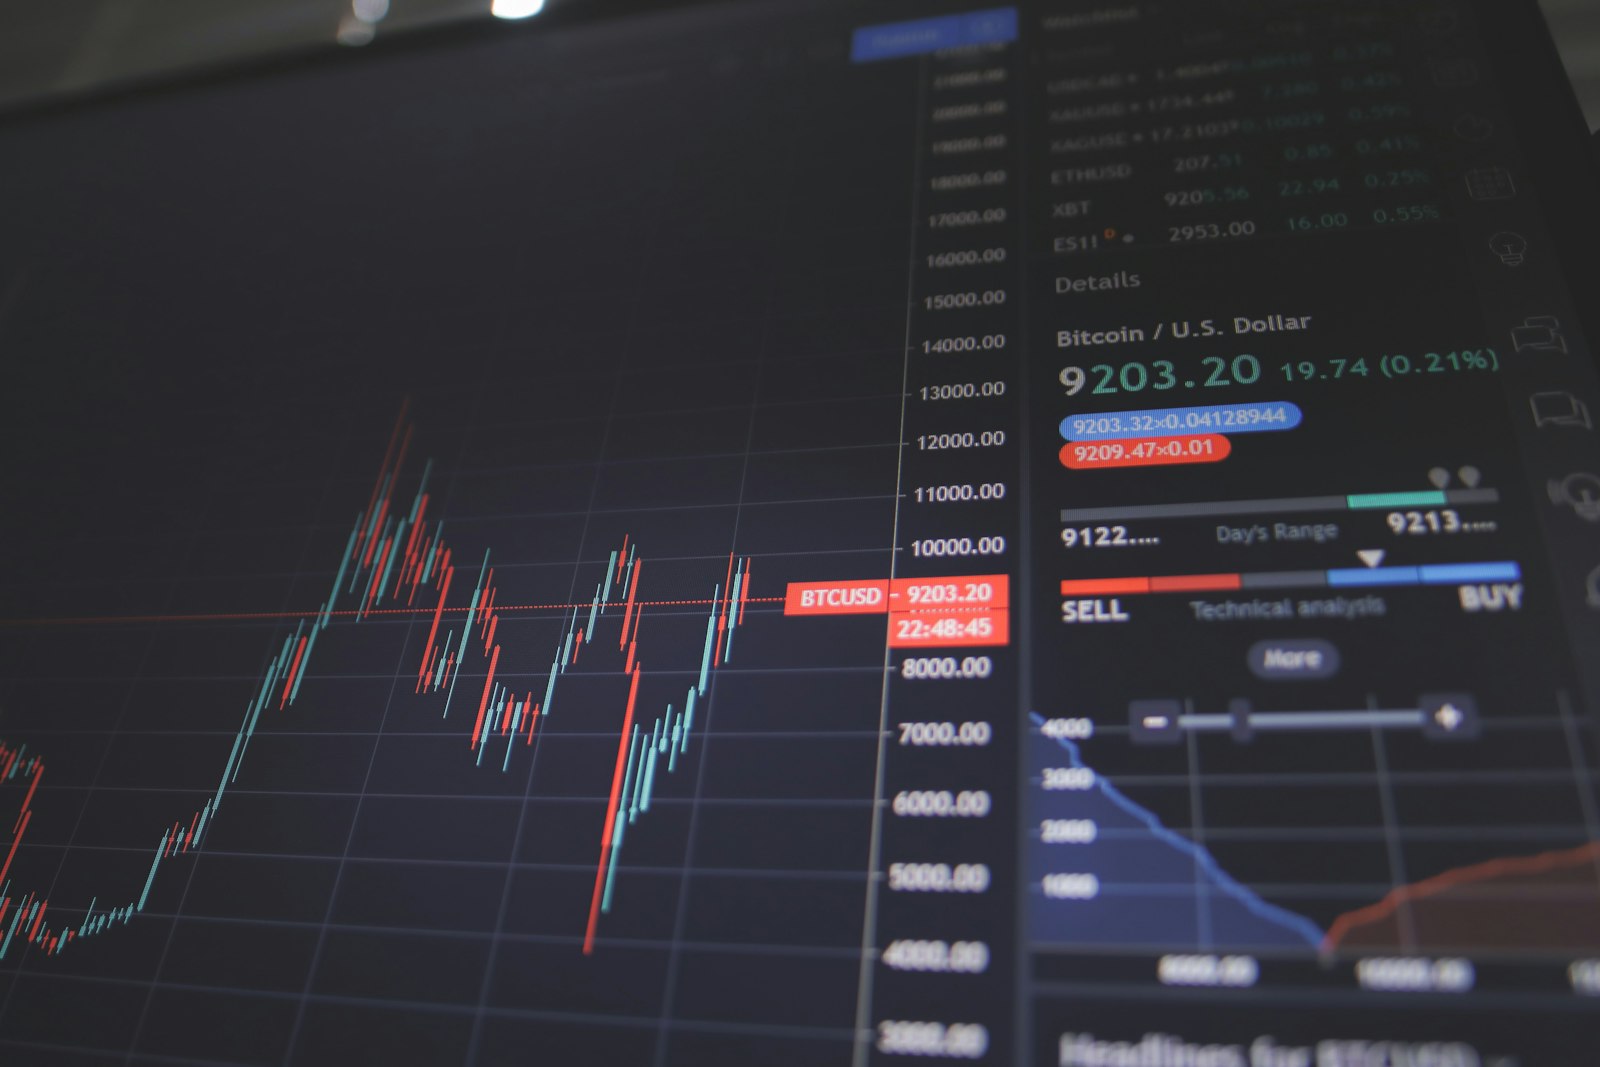
Why did the stock market rally 2% on Tuesday only to decline 1.8% on Thursday? For everyday observers, daily market price swings often appear chaotic, erratic, or disconnected from real-world economic facts. Headlines frequently offer simplified explanations for complex intraday trading dynamics.
While multi-year stock prices are fundamentally governed by corporate earnings and economic growth, daily price fluctuations are driven by liquidity flows, macroeconomic data releases, algorithmic trading execution, and institutional repositioning. In this systematic analysis, we break down the primary mechanisms driving daily market volatility.
The 5 Primary Catalysts of Daily Market Fluctuations
Intraday price action reflects the intersection of macroeconomic announcements, corporate reporting, and institutional trading architecture as documented by SEC Market Structure Analysis.
- 1. Corporate Earnings Reports & Forward Guidance: Quarterly earnings per share (EPS) and forward revenue guidance relative to consensus Wall Street analyst estimates.
- 2. Federal Reserve Monetary Policy & Speeches: Federal Open Market Committee (FOMC) interest rate decisions and nuanced language in press conferences.
- 3. Macroeconomic Economic Indicator Releases: Monthly Consumer Price Index (CPI), Gross Domestic Product (GDP), and Non-Farm Payrolls employment data.
- 4. Institutional Algorithmic & Systematic Flows: High-frequency trading algorithms executing systematic rebalancing and stop-loss triggers in milliseconds.
- 5. Geopolitical Events & Energy Volatility: International trade negotiations, election results, energy supply disruptions, and global supply chain shifts.
Daily Market Catalysts, Timing, and Typical Volatility Impact Compared
The table below summarizes the five primary daily market catalysts, their typical release schedules, and their historical volatility impact on global equity indices.
| Market Catalyst | Reporting Frequency / Timing | Key Metric Evaluated | Intraday Volatility Profile |
|---|---|---|---|
| Consumer Price Index (CPI) | Monthly (8:30 AM EST) | Core Inflation vs. Consensus Estimates | High (Immediate bond yield and index swings) |
| FOMC Interest Rate Decision | 8 Times Per Year (2:00 PM EST) | Rate Policy Statement & Press Conference Q&A | Extreme (Trillion-dollar cross-asset repositioning) |
| Non-Farm Payrolls (Jobs Report) | First Friday Monthly (8:30 AM EST) | Job Additions, Unemployment Rate, Wage Growth | Moderate-High (Signals labor market strength) |
| Mega-Cap Tech Earnings | Quarterly (After Market Close 4:00 PM) | Cloud, AI Capex, Forward Guidance | High (Heavily weights S&P 500 and Nasdaq) |
The Role of Algorithmic Trading and Liquidity Cascades
Today, institutional algorithmic execution accounts for over 70% of daily trading volume on U.S. exchanges according to data from FINRA Market Operations. Quantitative models scan incoming news feeds using natural language processing (NLP) to execute millions of shares within milliseconds.
When key technical support levels are breached, automated stop-loss algorithms trigger simultaneous sell orders, creating short-term liquidity cascades that temporarily disconnect market prices from fundamental business value.
Market Breadth and Advance-Decline Line Dynamics
A vital concept in understanding daily market movements is Market Breadth. Rather than looking solely at the headline S&P 500 index level, institutional analysts examine how many individual stocks participated in the day’s price movement.
When an index rises but the advance-decline line is negative (meaning more individual stocks fell than rose), the rally is driven narrowly by a handful of mega-cap technology corporations. Conversely, healthy and durable market movements are characterized by broad participation across financial, healthcare, industrial, and consumer sectors.
Why Long-Term Investors Must Filter Daily Noise
Recognizing the forces behind daily market fluctuations highlights a critical lesson for individual wealth builders: intraday price movements represent liquidity dynamics, not permanent changes in business enterprise value. Over rolling 10-to-20 year horizons, 100% of equity market returns are driven by corporate earnings growth, dividend reinvestment, and broad economic expansion.
The Mechanics of Short Squeezes and Derivative Positioning
In modern derivative markets, institutional options positioning (gamma exposure and delta hedging) plays a massive role in magnifying intraday stock market swings. When market makers hedge option contracts or short sellers are forced to buy shares to cover borrowing positions, stocks can experience rapid, violent upward intraday surges that have zero connection to real-time company fundamentals.
Step-by-Step Market Volatility Filter Checklist
Maintain emotional detachment and protect your capital from daily market volatility:
- Recognize Algorithmic Order Flows: Understand that intraday swings reflect quantitative liquidity cascades rather than fundamental business value changes.
- Filter Economic Data Releases: Review monthly CPI, GDP, and jobs reports with long-term perspective rather than reacting to short-term headlines.
- Track Advance-Decline Breadth: Evaluate whether market rallies are supported broadly across multiple sectors or concentrated in a few mega-caps.
- Enforce a 48-Hour Cooling-Off Rule: Prohibit same-day portfolio changes based on breaking news or market price surges.
- Rely on Automated Monthly Investing: Maintain disciplined automated transfers into broad-market index funds through custodians like Fidelity.
Understanding the Impact of Foreign Exchange and Currency Fluctuations
Global multi-national corporations in the S&P 500 generate over 35% of total revenue from international markets. When the U.S. Dollar strengthens significantly relative to foreign currencies (like the Euro or Yen), foreign revenues convert into fewer dollars, dampening reported corporate earnings.
Conversely, a weakening domestic currency makes American exports more price-competitive abroad and inflates international revenues upon currency conversion, providing a natural macroeconomic tailwind for global equities.
Essential Practical Strategies for Sustained Long-Term Progress
Translating personal finance principles into compounding lifetime results requires maintaining structured behavioral discipline across multiple economic cycles. By consistently automating cash flow distributions, eliminating unmonitored recurring expenses, and maintaining disciplined broad-market investment allocations through institutions like Vanguard or Fidelity, individuals insulate their households against macroeconomic volatility.
Furthermore, reviewing your asset allocation annually and conducting regular spending audits with tools recommended by the Consumer Financial Protection Bureau ensures your capital remains optimized for long-term growth and multi-generational financial autonomy.
Comprehensive Multi-Year Financial Case Analysis & Empirical Findings
To evaluate how these personal finance principles perform across real-world economic environments, academic researchers and wealth managers analyze longitudinal financial behaviors across rolling 10-year market cycles. The empirical data highlights that households employing systematic cash flow automation and low-cost index asset allocation consistently outpace discretionary spending peers by more than 300% in cumulative net worth.
Furthermore, maintaining adequate liquid buffers and eliminating revolving high-interest debt preserves financial solvency during macroeconomic downturns. By continuously aligning daily capital allocation with long-term financial independence targets, individuals build resilient, multi-generational wealth that easily withstands inflationary pressures.
Frequently Asked Questions (FAQ)
What is the VIX Index and why is it called the “Fear Gauge”?
The Cboe Volatility Index (VIX) measures the market’s expectation of 30-day forward volatility based on S&P 500 index options pricing. A VIX reading below 15 indicates calm market conditions, while readings above 30 signal elevated investor fear and institutional hedging.
Why does a strong employment report sometimes cause stock prices to fall?
If the economy is already experiencing inflation, an excessively strong jobs report can lead the Federal Reserve to keep interest rates higher for longer to prevent wage-price inflation spirals, which dampens stock valuation multiples.
How do quarterly options expiration dates (Triple/Quadruple Witching) impact market movement?
On the third Friday of March, June, September, and December, stock options, index options, and index futures expire simultaneously, resulting in massive trading volume surges and heightened intraday volatility as institutional traders roll contracts.
Should long-term investors try to buy stocks right after a negative macroeconomic report?
Rather than attempting to trade around economic data releases, maintaining consistent automated monthly dollar-cost averaging into broad-market index funds via custodians like Fidelity or Vanguard captures optimal average entry pricing without timing stress.
Strategic Conclusion and Next Steps
Daily market movements are the unavoidable noise of a liquid, global financial marketplace. By understanding the mechanical catalysts behind intraday price swings—from CPI releases to algorithmic order flows—investors can maintain emotional detachment and stay focused on multi-decade wealth accumulation.
Take control today: eliminate daily portfolio tracking habits, establish automated monthly investments, and let the long-term productive growth of global enterprise compound your wealth uninterrupted.